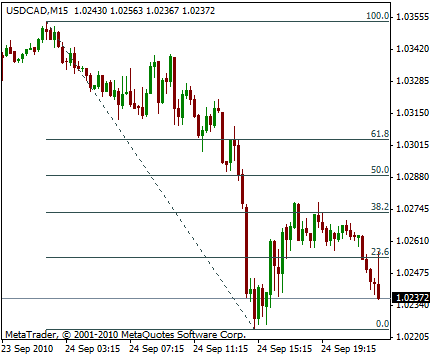
Fibonacci retracement is a widely used technical analysis tool that helps traders identify potential reversal levels in the market. This technique is based on the mathematical principles of Fibonacci sequences, which are prevalent in nature and financial markets. This blog post walks you through the basics of trading with Fibonacci retracements, with visuals to enhance your understanding.
What is Fibonacci Retracement?
Fibonacci retracement involves plotting horizontal lines on a price chart at key Fibonacci levels: 23.6%, 38.2%, 50%, 61.8%, and 78.6%. These levels act as potential areas of support or resistance, where price may reverse or consolidate.
How to Use Fibonacci Retracement for Trading?
Step 1: Identify the Trend
Before applying the tool, determine whether the market is in an uptrend or downtrend.
- In an uptrend, you draw Fibonacci retracement from the swing low to the swing high.
- In a downtrend, you draw it from the swing high to the swing low.
Step 2: Draw the Fibonacci Levels
Use your trading platform’s Fibonacci retracement tool to connect the high and low points. The software will automatically calculate and display the retracement levels.
Step 3: Analyze Price Action at Key Levels
Observe how the price interacts with the Fibonacci levels:
- 38.2%, 50%, and 61.8% are the most common retracement levels where reversals often occur.
- Look for candlestick patterns, volume spikes, or other confirmation signals at these levels.
Step 4: Plan Your Trades
- Entry: Enter trades near significant Fibonacci levels, supported by additional indicators or patterns.
- Stop Loss: Place stop losses slightly beyond the retracement level to minimize risk.
- Take Profit: Use the next Fibonacci level as a target, or base your decision on your risk-reward ratio.
Real-World Example
Chart Illustration

In the chart, a swing high and low have been connected, revealing retracement levels. Notice how the price reacts at the 50% and 61.8% levels before continuing in the direction of the trend.
Trade Setup
- Entry: A bullish engulfing candle forms at the 61.8% retracement level.
- Stop Loss: Below the 78.6% level.
- Take Profit: At the previous swing high, ensuring a favorable risk-reward ratio.
Tips for Effective Use
- Combine Fibonacci retracement with other technical tools like trendlines, moving averages, or oscillators for stronger signals.
- Avoid using Fibonacci retracement in isolation; always confirm signals with price action.
- Practice on demo accounts to gain confidence in identifying the right swing points and applying the tool effectively.

